Introduction to Azure Data Factory

Azure Data Factory
A managed service for orchestrating and managing diverse data, especially in hybrid environments where some data sources reside in the cloud and others are on-premise. Developers can use Data Factory to transform semi-structured, unstructured and structured data from on-premises and cloud sources into trusted information.This Services allows developers to compose data storage, movement, and processing services into streamlined data pipelines.

Insights
Data Analytics has begun to change its emphasis from the traditional data warehouse as it ‘s one true source for analytics to hybrid environments. Companies are looking for insights into all kinds of data from sensor data, to log files, and social media. There is still a need for data warehouses and they will be moved to the cloud in conjunction with Big data for better insights. Data Factory is the Azure ETL tool used to be able to manage these hybrid environments. The Azure Data Factory helps the business by providing a solution to the problem of hybrid environments and offer the plumbing necessary to help them exist together in the Cloud.

Data Factory Demo
I’m going to show the Azure Data Factory Preview interface and do a simple demonstration on how to move data from an On Premise SQL Server table to an Azure SQL Server table. We will see how to create a Data Gateway, Linked Services, Datasets, and Pipelines. The basic tools needed are the Azure Portal, Azure PowerShell, and a text editor. We will be creating objects in the Azure Portal and programming JSON files that will be run by PowerShell commands.

New Azure Portal
The site for the Azure Portal allows you to pin objects to the main screen or access them from a menu to the left. The icon with the building is a Data Factory.

Azure Portal

Data Factory
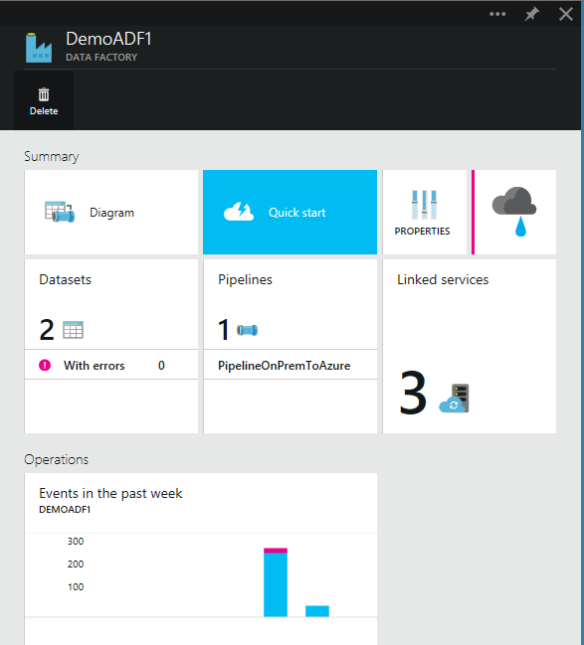
Once you click on the DemoADF1 (Data Factory) you will see it open to a section with more options. This is a simple data factory that well go through in detail. The data factory UI shows 4 important sections that we will cover today which are:

1. Linked services
2. Datasets
3. Pipelines
4. Diagram

Data Factory

Here is the PowerShell command to add a new data factory. We can set variables for the data factory and resource group and then add them to the command.

$df = "DemoADF1"
$rg = "Default-SQL-EastUS"

#New-AzureDataFactory -ResourceGroupName $rg -Name $df -Location "WestUS"

Linked services
The first thing we want to set up is the Linked service by adding a Data Gateway to our On Premise machine. This will allow us to access the On Premise SQL Server instance in the Data Factory. Select Linked services and go to the Data dateway button at the top which will give you a New data gateway screen. Add the name and region for the gateway.

New Data Gateway

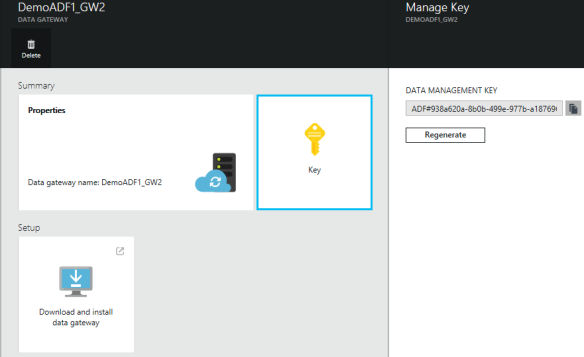
Configure and register the data gateway. Get the registered key and add to the on Premise Microsoft Data Gateway application on the local machine. You can install Microsoft Data Gateway application from this link:  http://www.microsoft.com/en-us/download/details.aspx?id=39717

Configure New Gateway

Data Gateway Manage Keys

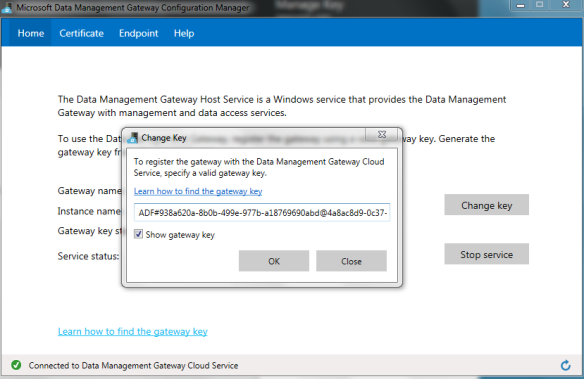
Add register key to the On Premise Microsoft Data Gateway.

Microsoft Data Gateway OnPremise Key

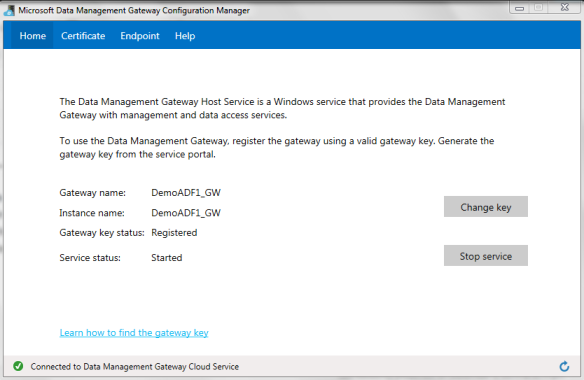
Once the key is registered you will see a registered status and the same name of the gateway will appear in the On  Premise machine.

Registered Data Gateway

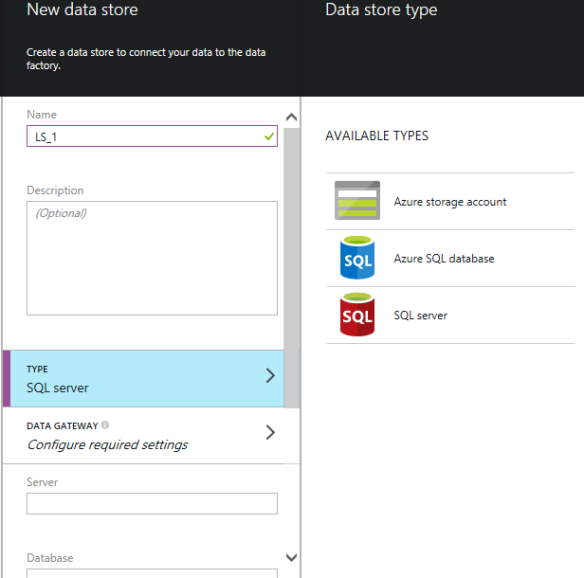
We then want to add a Data Store for this On Premise SQL Server which can be done through the Azure Portal or from a PowerShell script using a JSON file. I will show you both methods below.

This is my On Premise SQL Server Linked service via Azure Portal setup.

New On premise Data store

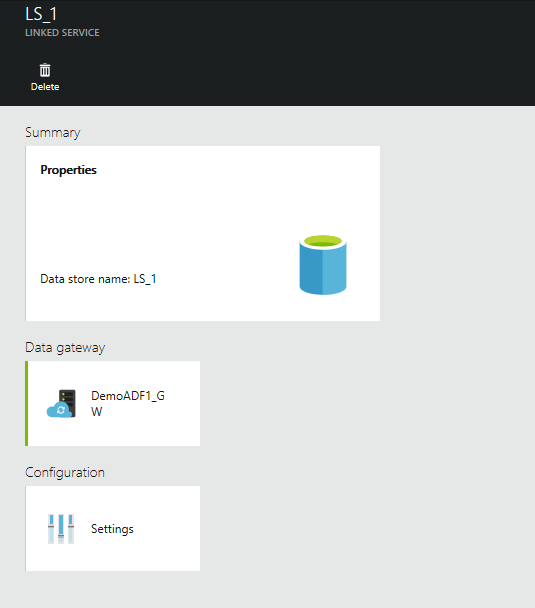
Add the Data gateway to the On Premise SQL Server Linked Service.

New Onpremise Data store With Gateway

Here is my On Premise SQL Server Linked Service via PowerShell setup. MyOnPremisesSQLDB.json file is created below to set the type, connection string, gatewayname and gatewaylocation.

{
    "name": "MyOnPremisesSQLDB",
    "properties":
    {
        "type": "OnPremisesSqlLinkedService",
        "connectionString": "Data Source=MRNR-E6400-01\\JKSQLSERVER;Initial Catalog=AdventureWorks2012;Integrated Security=False;User ID=jesse;Password=******;",
        "gatewayName": "DemoADF1_GW",
        "gatewayLocation": "westus"
    }
}

Then we execute the JSON script using Aure PowerShell. First we need to connect to the Azure Account using the add account script and login to azure.

Add-AzureAccount

We need to add in the Azure Data Factory cmdlets with the following command

switch-azuremode AzureResourceManager

Finally we can execute the New-AzureDataFactoryLinkedService which asks for the resource group name, data factory name, linked service, and link to the JSON file.

New-AzureDataFactoryLinkedService -ResourceGroupName  "Default-SQL-EastUS"  -DataFactoryName "DemoADF1" -Name "LS_1" -File "C:\\Powershell\\MyOnPremisesSQLDB.json" | Format-List

Next we can add the Azure SQL Server Linked service via Azure portal.

New Azure SQL Server Data store

We can also add the Azure SQL Server Linked service via a JSON file and PowerShell. MySQLAzureDB.json file is created below and we need to set the AzureSqlLinkedService type and connection string.

{
"name": "MySQLAzureDB",
"properties":
{
"type": "AzureSqlLinkedService",
"connectionString": "Server=tcp:exv4gm2p9l.database.windows.net,1433;Database=MarinerDB;User ID=jessekraut@exv4gm2p9l;Password=Dask1995;Trusted_Connection=False;Encrypt=True;Connection Timeout=30"
}
}

Run the PowerShell script to create the linked service for the Azure SQL Server connection.

New-AzureDataFactoryLinkedService -ResourceGroupName  "Default-SQL-EastUS"  -DataFactoryName "DemoADF1" -Name "LS_2" -File "C:\\Powershell\\MySQLAzureDB.json" | Format-List

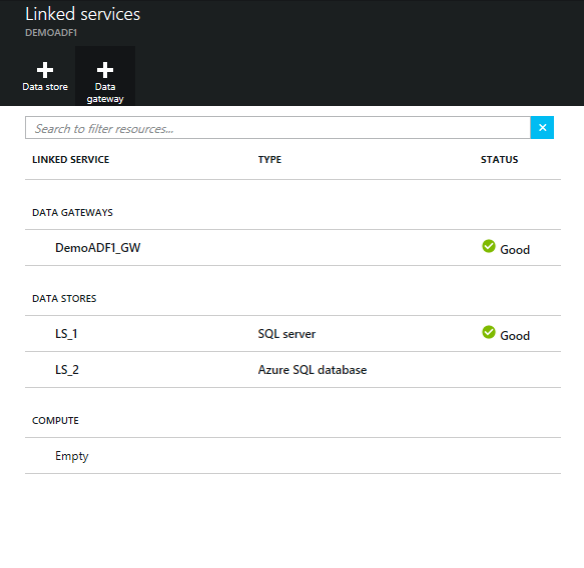
Once we add all the Linked services you see all of them in the Azure Portal. The Good status indicator or no indicator means the connections are correct.

Data Factory Linked Services


Datasets
We now need to add source and destination tables to the data factory and this is done with JSON metadata files and PowerShell commands. First we want to add the On Premise SQL Server table to the Data Factory. Some important element which are basically the same for source and destination metadata. We have the name; the structure which is the fields and types; we have the location which is the type, table, and linked service. Lastly is the availability which his how often the data slices are run for and in this case its an hour.

{
"name": "MyOnPremisesSQLDB_Table",
"properties":
{
"structure":
[
{"name": "EmpId", "position": 0, "Type": "String"},
{"name": "FirstName", "position": 1, "Type": "String"},
{"name": "LastName", "position": 2, "Type": "String"},
{"name": "AddressName", "position": 3, "Type": "String"}
],

"location":
{
"type": "OnPremisesSqlServerTableLocation",
"tableName": "Employees",
"linkedServiceName": "LS_1"
},
"availability":
{
"frequency": "Hour",
"interval": 1,
"waitOnExternal":
{
"retryInterval": "00:01:00",
"retryTimeout": "00:10:00",
"maximumRetry": 3
}

}
}
}

Execute the PowerShell script to run the New-AzureDataFactoryTable.

New-AzureDataFactoryTable  -ResourceGroupName "Default-SQL-EastUS" -DataFactoryName "DemoADF1" -File C:\Powershell\MyOnPremisesSQLDB_Table.json

Next we want to add the Azure SQL Server destination table and here is the JSON script.

{
"name": "MySQLAzureDB_Table",
"properties":
{
"structure":
[
{"name": "EmpId", "position": 0, "Type": "String"},
{"name": "FirstName", "position": 1, "Type": "String"},
{"name": "LastName", "position": 2, "Type": "String"},
{"name": "AddressName", "position": 3, "Type": "String"}
],

"location":
{
"type": "AzureSQLTableLocation",
"tableName": "Employees",
"linkedServiceName": "LS_2"
},
"availability":
{
"frequency": "Hour",
"interval": 1

}

}
}

Execute the Power Shell script to run the New-AzureDataFactoryTable.

New-AzureDataFactoryTable  -ResourceGroupName "Default-SQL-EastUS" -DataFactoryName "DemoADF1" -File C:\Powershell\MySQLAzureDB_Table.json

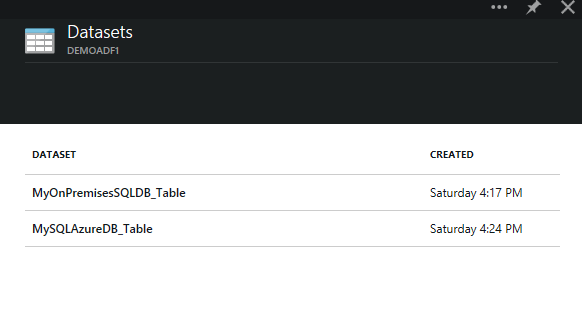
Once we execute both dataset scripts we can see them in the Azure portal under the Datasets section of the data factory.

Data Factory Datasets


Pipelines
We now need to create a pipeline which is the connection between the 2 tables where we create activities and transformations. We have name and properties to set and you will notice an activities section to set the type of pipeline activity. In this case we want to set this to be a CopyActivity and include both of the tables in the input and output section. We have an option to set a transformation but in this case we just list the source and destination objects.

{
"name": "PipelineOnPremToAzure",
"properties":
{
"description" : "This pipeline has one Copy activity that copies data from an on-prem SQL to Azure blob",
"activities":
[
{
"name": "CopyFromSQLtoAzure",
"description": "Copy data from on-prem SQL server to Azure",
"type": "CopyActivity",
"inputs": [ {"name": "MyOnPremisesSQLDB_Table"} ],
"outputs": [ {"name": "MySQLAzureDB_Table"} ],
"transformation":
{
"source":
{
"type": "SqlSource",
"sqlReaderQuery": "select * from dbo.Employees"
},
"sink":
{
"type": "SqlSink"
}
},

"Policy":
{
"concurrency": 1,
"executionPriorityOrder": "NewestFirst",
"style": "StartOfInterval",
"retry": 0,
"timeout": "01:00:00"
}

}
]
}
}

Execute the PowerShell script to run the pipeline JSON file.

New-AzureDataFactoryPipeline  -ResourceGroupName "Default-SQL-EastUS" -DataFactoryName "DemoADF1" -File C:\Powershell\PipelineOnPremToAzure.json

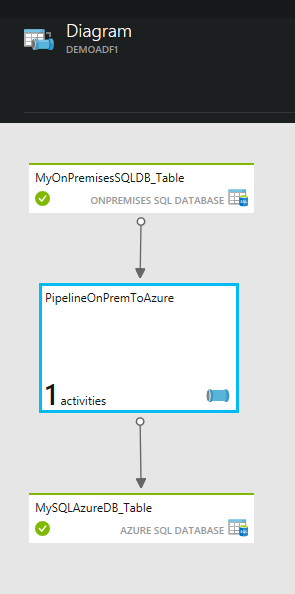
Once we run the PowerShell script we can see dataset and pipeline additions in the Diagram window.

Data Factory Diagram

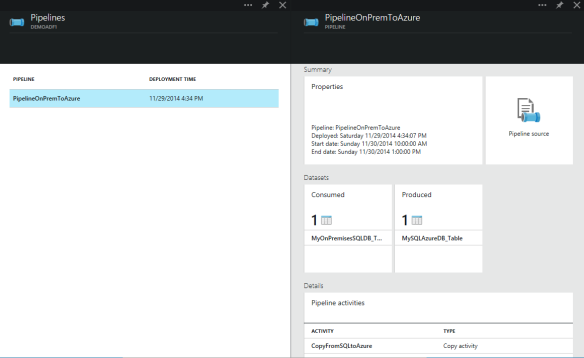
We can also see the pipeline properties by selecting the Pipelines link and drill into PipelineOnPremToAzure.

Data Factory Pipeline Properties

Our last step is to start the Pipeline Active Period to execute from a start and end time.

Set-AzureDataFactoryPipelineActivePeriod -ResourceGroupName "Default-SQL-EastUS" -DataFactoryName "DemoADF1" -StartDateTime "2014-11-30 3 PM" –EndDateTime "2014-11-30 6 PM" –Name PipelineOnPremToAzure

Data Factory Results
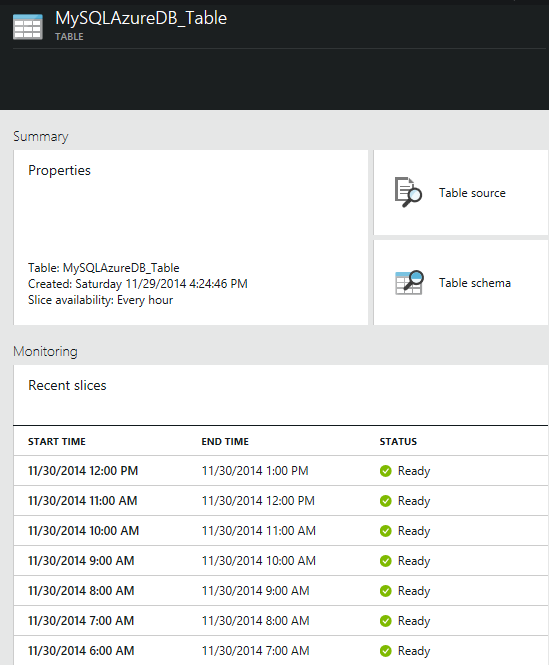
You can look in the Employees table in the Azure SQL Server to see that it copied data from the On Premise SQL Server table. Each time it runs there will be an entry with a Ready Status meaning it completed successfully. If it fails it will say Failed and you can click on it to see what the error is for that data slice.

Azure SQL Table Execution Log

You can access all the files for this demo at the following link AzureDataFactory1


Resources:
Azure Data Factory reference
http://blogs.technet.com/b/dataplatforminsider/archive/2014/10/30/the-ins-and-outs-of-azure-data-factory-orchestration-and-management-of-diverse-data.aspx

Azure Data Factory CmdLets
http://msdn.microsoft.com/en-us/library/dn820234.aspx?WT.mc_id=Blog_SQL_Announce_DI

Azure Linked Service code
http://msdn.microsoft.com/en-us/library/azure/dn834986.aspx

Videos
https://channel9.msdn.com/Shows/Data-Exposed/Introducing-Azure-Data-Factory
http://channel9.msdn.com/Events/TechEd/Europe/2014/DBI-B317

Tutorial
http://azure.microsoft.com/en-us/documentation/articles/data-factory-tutorial/
Tutorial Sample Files
https://github.com/Azure/Azure-DataFactory/tree/master/Samples/ADFWalkthrough


Stay tuned….Azure Data Factory with HDInsight.

Improve ETL Automation and Performance with TimeXtender 2014

TimeXtender has been an integral tool for rapid ETL development and data warehouse automation. TimeXtender is a user friendly “point and click” tool that provides the basis for a BI solution, including data extraction, data validation, data transformation, and the building of data warehouses and OLAP cubes without the need for hard coding the SQL code. Furthermore, TimeXtender works seamlessly with Microsoft SQL Server, MS Analysis Server and other Microsoft BI offerings.

Recently they have released the TX2014 Service Release 1 (SR1) with many new features and benefits from previous releases. Many of the things that I felt could help improve the product have really shined in this release. I first want to talk about the benefits of the TimeXtender in general and then I will discuss the new features.

Benefit 1 – TimeXtender Visual Interface
TimeXtender has a nice visual interface showing you the Source, Stage, and DW areas of you database warehouse all on one screen. It’s a very easy tool to navigate through.

Data Warehouse Automation

Benefit 2 – Data Warehouse Creation Made Easy
You can add 3 source tables and 3 stage tables and 3 Data warehouse tables in a few clicks. The formatting and transformations of the data is where you will spend your time but you can have that done in a few hours. If you were to build 3 tables from source to stage to DW it would take you a few days in traditional SSIS.

Benefit 3 – Type 2 Slowly Changing Dimensions in a Jiffy
Historical Data is one of the hardest ETL designs in data warehouses. Requires a lot of development in SSIS. You can build a Type 2 Slowly changing dimension that will record historical data in a few hours where as in traditional SSIS it would take a few days.


New Features 1 – Set Based Transformations
The previous versions of TimeXtender used a user defined function to do a transformation. This was done by creating a view from the stage table and adding the function to that view which caused performance issues. So with the new TX2014 SR1 release they added a Set based design to the transformations which added a case when statement to the view. The next few screen shots show the old and new designs.

UDF Method (old method):
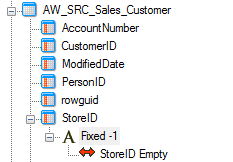
Customer table has a transformation on the StoreID column:

Transformation

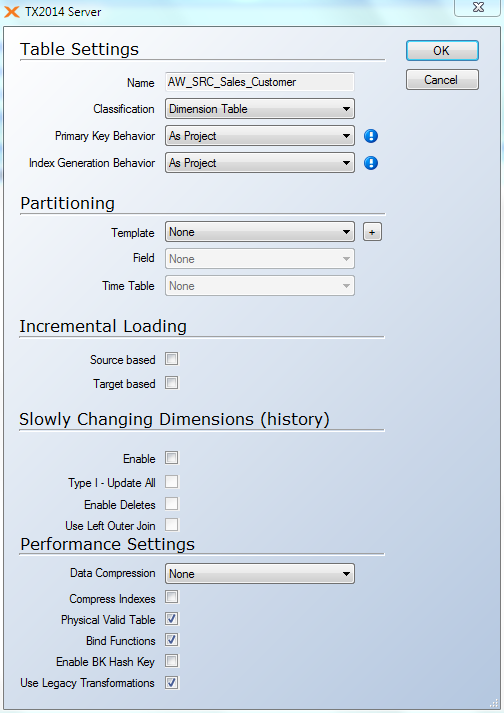
The “Used Legacy Transformations” setting at the table level if checked will use the UDF transforms otherwise it will be a Set Based transformation.

Use Legacy Transformation

Customer View with the UDF:

Customer View with UDF

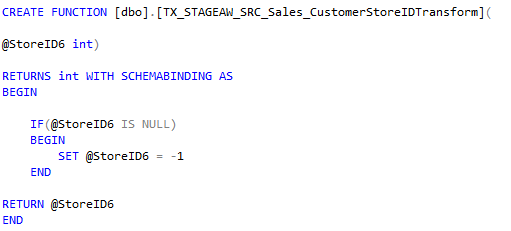
User defined function for StoreID column:

User Defined Function

Set Based Method (New Method):
Product table has a transformation on the Color column:

Transformation

Product view with the case when statement:

Set Based Transformation

There is one check box that is set at the table level that gives you the choice to run legacy UDF transforms or Set based case when transforms. The new Set Based transformation will gives us better performance then the legacy method.

New Features 2 Managed Parallel Package Execution Threads and Table Dependencies
This is a great new feature because before we only could run the packages in serial. TX2014 Service Release 1 (SR1) has added a new Execution overview log that will allow us to see the threads and which type of execution was run. So we can see the load to source package time of execution as well as the transform load to clean times. One feature that keeps this organized is the table dependencies addition which says that these tables need to run on the same thread because they depend on each other. With that being said you still need to order them in TimeXtender by their dependency. So we want to run a lookup table first then the main table that uses the lookup next but all on the same thread.

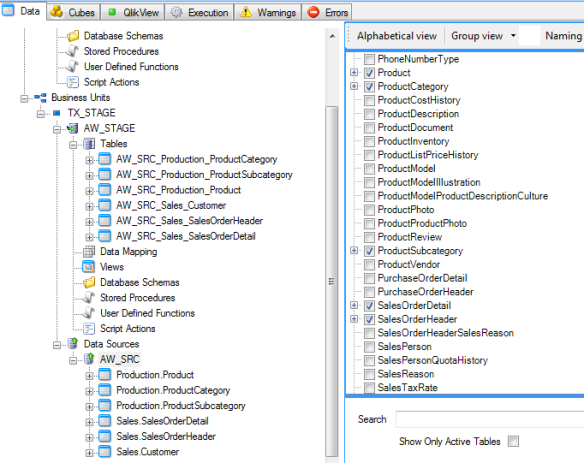
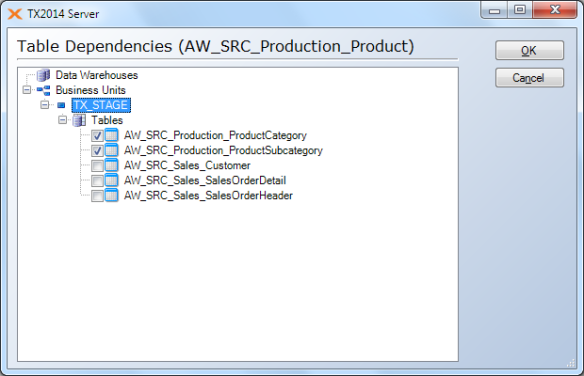
Product table for example has a relationship with Product Subcategory and Product Subcategory has a relationship with Product Category. So we want them on the same thread and ordered properly in TimeXtender. We can add a dependency of Product Subcategory and Product Category on the Product table so they run on the same thread.

Table Dependencies

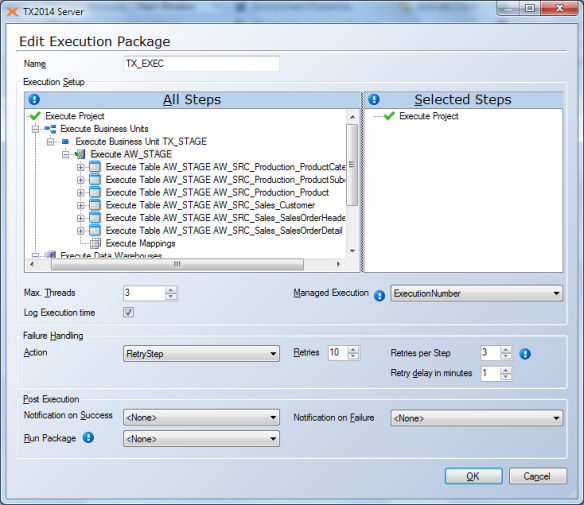
We can set up the Execution design to have many threads which is a new feature in TimeXtender. In this example we set up 3 threads and have 6 tables on those threads.

Execution Package

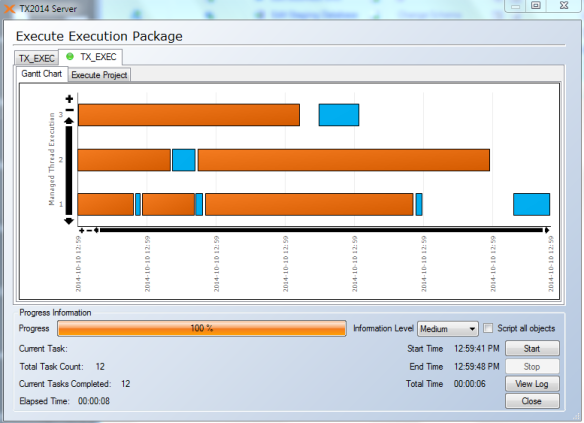
TimeXtender will manage which threads to put each table based on dependencies that are set and ordering. They have added in a cool new Gannt Chart with the log information. Each bar represents a package run and it shows the thread it was run on.

Managed Thread Execution

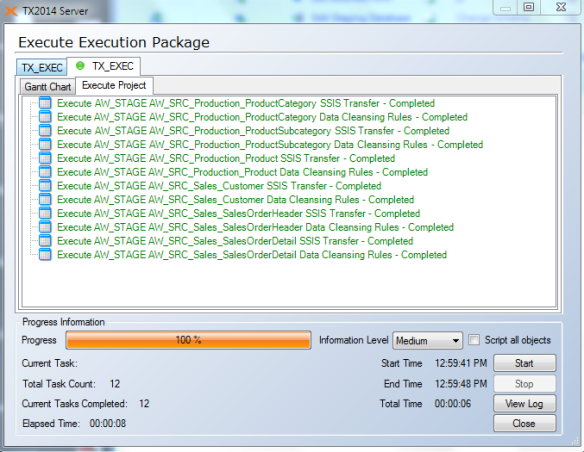
Also in the Execution log is the execution order of each of the packages.

TX Execute Project

New Feature 3 – Table Execution Log
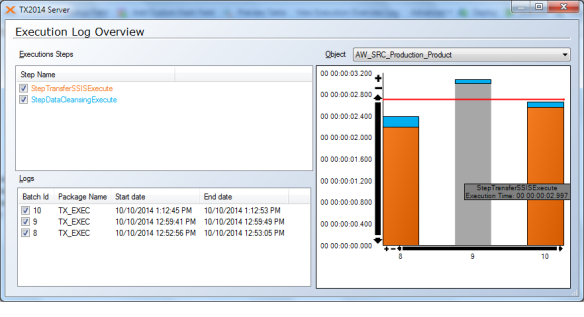
The last new feature that I will share is the execution log from the individual table. We can look at the tables execution time for every batch that is run. This is an example of the Product table which had 3 batches run and shows us the load to source and load to clean packages and if you roll over the bar it shows the time it took to execute.

Execution Overview log

The Execution log features are something I have wanted to see where we can get a better glimpse of what is happening under the hood. This gives us more confidence of how the application is running and possible methods of what maybe causing performance issues.


If you are interested in learning more or seeing a demo, email my colleague, Sally Phillips and she’ll get right back to you.

SSAS Tabular Logging Methods

I was asked recently about Logging SSAS Tabular models to see who was using the model I created. I have been working in Corporate America so I needed to come up with several options based on what they will and will not allow in their environment. In this blog I want to make a few suggestions on different methods for SSAS Tabular Logging. There maybe more and I would love to hear about them if you want to share.
I first began looking at the SSAS QueryLog that is built into SSAS because it works for the Multidimensional models and I found that it would not work for Tabular. Upon setting it up it just doesn’t log to the table you configure. Here is a blog I read where they had a similar problem SSAS Tabular QueryLog not working. So I began to search and I found some interesting methods that people have used and each one has its plus and minus factor depending on your needs.

    • Data Management View Query – This method will get current session connection information.
      Note: You will need to have ETL running to get users sessions every 5 min because it only current info.
      Link: http://msdn.microsoft.com/en-us/library/hh230820.aspx
    • Activity Viewer (CodePlex) – Open source application that shows current SSAS activity.
      Note: This is a nice GUI application tool to see current activity which pulls from the DMVs. Remember its only current activity not something logged over time.
      Link: http://sqlsrvanalysissrvcs.codeplex.com/
    • ASTrace2012 (CodePlex) – Creates a utility that runs as a Windows service, connecting to Analysis Services 2012 and logging trace events into a SQL Server table using the SQL Server Profiler format.
      Note: This is a tool that generates a service which can start and stop traces. The nice thing about traces is they can track information over time as long as the profiler trace is running.
      Link: https://sqlsrvanalysissrvcs.codeplex.com/
    • SQL Server Extended Events (XEvents) to Monitor Analysis Services – Using XMLA to run the trace and delete the trace which logs the data to a Microsoft SQL Server Extended Event log file (.xel). This can be parsed in a simple SQL statement to get the columns from the file.
      Note: This is very powerful you can create the start and stop XMLA scripts to begin the profiler trace and configure any elements in the XMLA to be logged. The advantage is less overhead and resources then the GUI.
      Link: http://markvsql.com/2014/02/introduction-to-analysis-services-extended-events/
    • SQL Profiler Trace – Run the SQL Profiler to for Analysis Services and log to a database/file. This can be run at command line, GUI, SQL Stored Procedures, and SQL Agent Jobs.
      Note: There a few different ways to get a trace going and the GUI has the most overhead and uses the most resources. The command line and stored procedures have less overhead using less resources but require more configuration.
      Link: http://technet.microsoft.com/en-us/library/ms191276.aspx


SSIS Methods to Process SSAS Tabular Partitions

I’ve been working on a way to process SSAS Tabular Partitions using SSIS. At the current company I’m working at we need to use SSIS to process our tabular models weather it’s a full process on the database or just a partition. This blog focuses on processing a partition because I only want to process the most current data to my model so I base the partition on a date range. I’m using the Adventure Works 2012 tabular model for my example in this article. I want to focus on 2 methods of which either one can be used it’s just based on your comfort with the technology.

The 2 SSIS Methods to process the tabular Model:

  • C# Script using AMO
  • SSIS Analysis Services Execute DDL Task

The first thing I will mention is that you need to look at how the SSAS Tabular Partition is processed manually to see how you can use these 2 methods in SSIS.

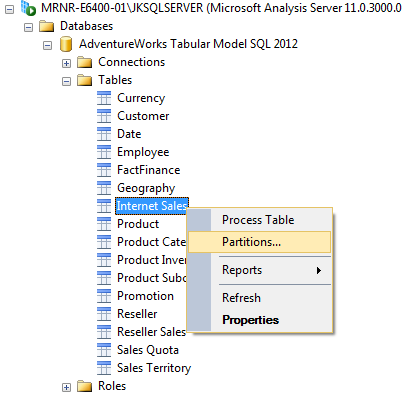
1. Get the XMLA (XML for Analysis) from SQL Server Management Studio. To access the SSAS Tabular instance you right click on the table with the partition and select Partitions.

ssas1

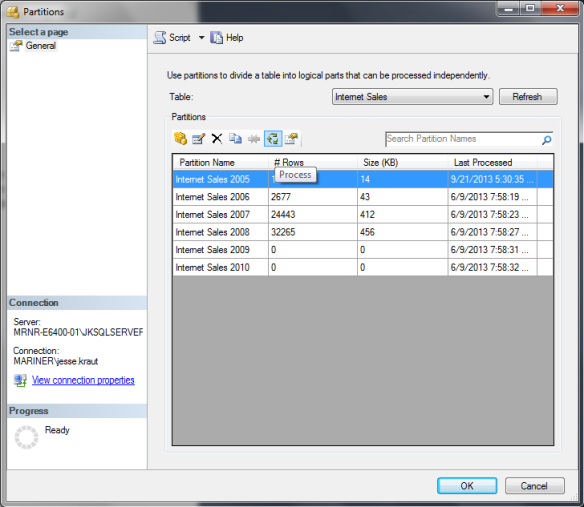
Select the Partition you want and the Process button.

ssas2

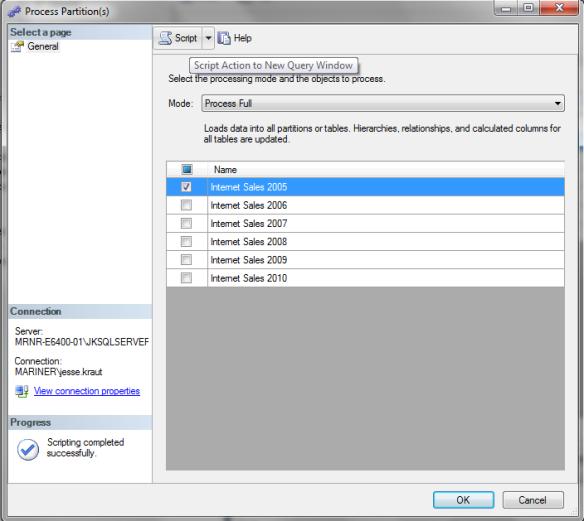
Select the Process Mode in our case you want to Process Full then select the Script option and choose the Script Action to New Query Window.

ssas3

This gives us the XMLA script that you can execute to process the partition selected.

<Process xmlns="http://schemas.microsoft.com/analysisservices/2003/engine">
  <Type>ProcessFull</Type>
  <Object >
    <DatabaseID>AdventureWorks Tabular Model SQL 2012</DatabaseID>
    <CubeID>Model</CubeID>
    <MeasureGroupID>Internet Sales_fdac9a13-4019-4773-b193-7cca3a4883eb</MeasureGroupID>
    <PartitionID>Internet Sales_eda26cf6-7bda-42ad-b31b-d7dc3ec08e6f</PartitionID>
 </Object >
</Process>

2. Create a C# script within SSIS that will allow you to generate the XMLA script and add variables so that it can be dynamic.
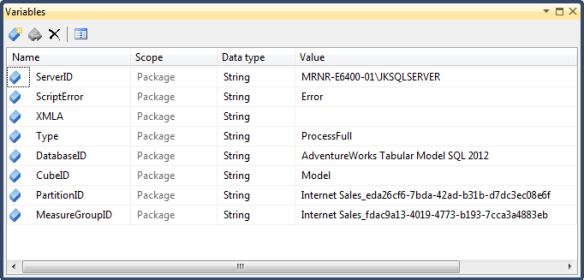
Create several variables to allow us to make dynamic changes to the script because you may change databases, models, or partitions.

ssas5

In our script task you want to add the ServerID, DatabaseID, CubeID, PartitionID, Type, and MeasureGroupID to the ReadOnlyVariables. You also want to add the XMLA variable to the ReadWriteVariables.

The following is a code snippet of the XMLA generated dynamically from the variables in a C# script and sent to the XMLA variable.

public void Main()
{
 try
 {
 StringBuilder xmla = new StringBuilder();
 xmla.AppendLine("<Process xmlns=" + "\"http://schemas.microsoft.com/analysisservices/2003/engine\"" + ">");
 xmla.AppendLine("<Type>" + Dts.Variables["Type"].Value.ToString() + "</Type>");
 xmla.AppendLine("<Object >");
 xmla.AppendLine("<DatabaseID>" + Dts.Variables["DatabaseID"].Value.ToString() + "</DatabaseID>");
 xmla.AppendLine("<CubeID>" + Dts.Variables["CubeID"].Value.ToString() + "</CubeID>");
 xmla.AppendLine("<MeasureGroupID>" + Dts.Variables["MeasureGroupID"].Value.ToString() + "</MeasureGroupID>");
 xmla.AppendLine("<PartitionID>" + Dts.Variables["PartitionID"].Value.ToString() + "</PartitionID>");
 xmla.AppendLine("</Object >");
 xmla.AppendLine("</Process>");

 Dts.Variables["XMLA"].Value = xmla.ToString();
 }
 catch (Exception e)
 {
 Dts.Variables["ScriptError"].Value = e.Message.ToString();
 }

 Dts.TaskResult = (int)ScriptResults.Success;
}

The idea is that you use the StringBuilder library to design our same XMLA script but you add the all the variables in the right places and send it the XMLA variable for use in the next piece.

3. Method 1: C# Script using AMO

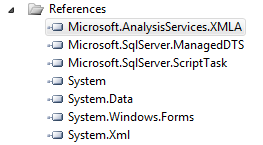
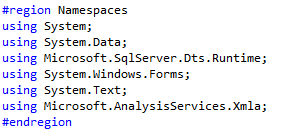
With the XMLA script above created you just need a way to execute it. First you need to add the Microsoft.AnalysisServices.XMLA assembly to your script references so you can access the Microsoft.AnalysisServices.Xmla namespace. This can be a pain in the butt to find but I found it on my machine under C:\windows\assembly\gac_msil\microsoft.analysisservices.xmla and I picked the latest version of the microsoft.analysisservices.xmla.dll.

ssas8

ssas10

Finally you just add to the script we used to generate the XMLA script and execute it
with AMO commands. You instantiate the XmlaClient and connect with the Server
variable. Then you execute the send command and disconnect from the server.

public void Main()
{
 try
 {
 StringBuilder xmla = new StringBuilder();
 xmla.AppendLine("<Process xmlns=" + "\"http://schemas.microsoft.com/analysisservices/2003/engine\"" + ">");
 xmla.AppendLine("<Type>" + Dts.Variables["Type"].Value.ToString() + "</Type>");
 xmla.AppendLine("<Object >");
 xmla.AppendLine("<DatabaseID>" + Dts.Variables["DatabaseID"].Value.ToString() + "</DatabaseID>");
 xmla.AppendLine("<CubeID>" + Dts.Variables["CubeID"].Value.ToString() + "</CubeID>");
 xmla.AppendLine("<MeasureGroupID>" + Dts.Variables["MeasureGroupID"].Value.ToString() + "</MeasureGroupID>");
 xmla.AppendLine("<PartitionID>" + Dts.Variables["PartitionID"].Value.ToString() + "</PartitionID>");
 xmla.AppendLine("</Object >");
 xmla.AppendLine("</Process>");        

 Dts.Variables["XMLA"].Value = xmla.ToString();

 XmlaClient clnt = new XmlaClient();
 clnt.Connect(Dts.Variables[&amp;quot;ServerID&amp;quot;].Value.ToString());
 clnt.Send(xmla.ToString(), null);
 clnt.Disconnect();
 }
 catch (Exception e)
 {
 Dts.Variables["ScriptError"].Value = e.Message.ToString();
 }

 Dts.TaskResult = (int)ScriptResults.Success;
}

This is one way of processing the partition and a preferred preference if you feel comfortable with C# and Analysis Management Objects.

4. Method 2: Analysis Service Execute DDL Task

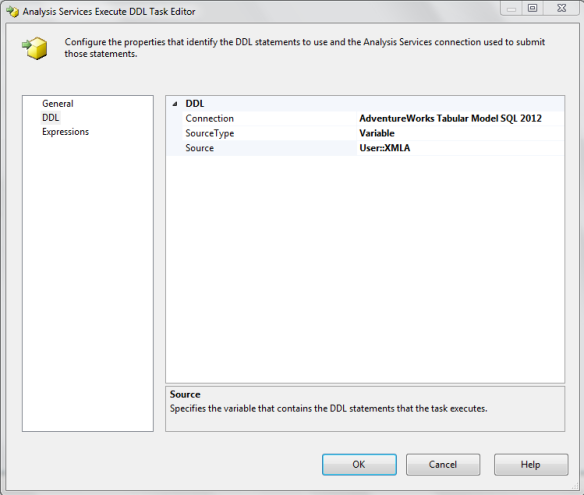
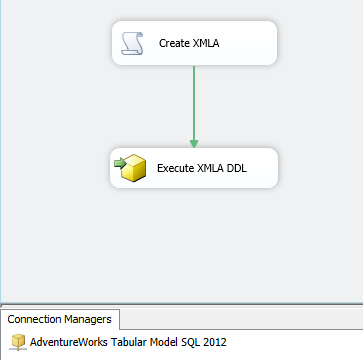
This method uses the SSIS task designed to execute XMLA scripts. Again you are using the original C# script to generate the XMLA Script. You simply make a connection to the SSAS Tabular instance via a connection string. You add the XMLA variable to the DDL command so that we pass in the generated XMLA script to the SSIS task.

ssas12

Once you add the connection string and the XMLA variable set in the task you are good to go. You have a second method to process the XMLA Script using a SSIS Analysis Service Execute DDL Task.

ssas11

SSAS Tabular Documentation Tool Part 1: The Overview

Do you have a need for real-time SSAS Documentation?

BISM Tabular models have started to play a crucial role in Microsoft’s Data warehouse design as the new technologies like Power View and Excel Pivot Tables with PowerPivot have become the front end presentation layers for our data and we need a way to understand the objects in our tabular models. We always have story about our data that needs to be told beyond the naming conventions we give each field or objects. We look at the data and say what does this value mean when all we have is a simple field name like order quantity. The Tabular documenter is a tool that provides a means to extract all the information from any BISM tabular model within SQL Server Analysis Services and allows the user to document it. Tabular Models can be built in Visual Studio and deployed to SSAS and they can be built in Excel PowerPivot and deployed from SharePoint to SSAS. The tabular documenter is an integral part to present a layer of documentation to support these efforts and make the designs more clear and understandable.

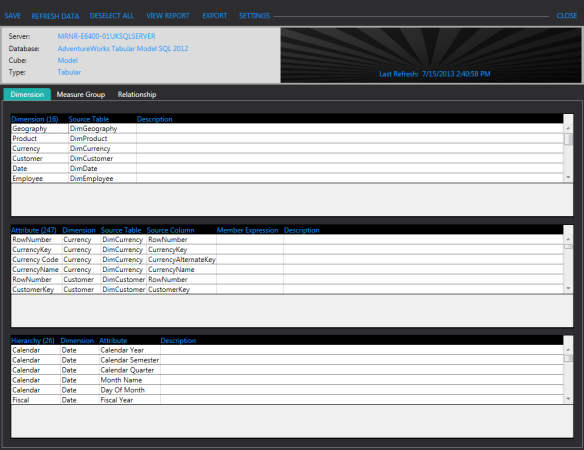
Here is screen shot of the Application:

tabdoc1

The application allows for a connection to a single instance of a BISM tabular model and the user interface uses a tab control containing the following subject areas: Dimensions, Measure Groups, and relationships. Each of these tabs contains controls that have an excel like spreadsheet appeal with information from each of the objects. The user can select a row within the controls which enables access to a description field textbox to add a description. This data can be saved back to a database and edited whenever desired.

This application is designed to run as a stand-alone application and also is an Excel Add-In. The Excel Add-In will allow for access to the stand-alone application from the excel tab ribbon design.

Stay tuned for my next post SSAS Tabular Documentation Tool Part 2: The Design that will give a look into the design of the application and all the features. Currently I am making some additions for Multidimensional cubes that I will talk about in the next blog on the design.

TabularDocumenterSplash

TimeXtender – Lookups and Relationships

TimeXtender is a new tool that I’ve been using to rapidly increase our ETL Development. Check out the site: TimeXtender

There are two ways you can add a lookup and have relationships configured in TimeXtender:

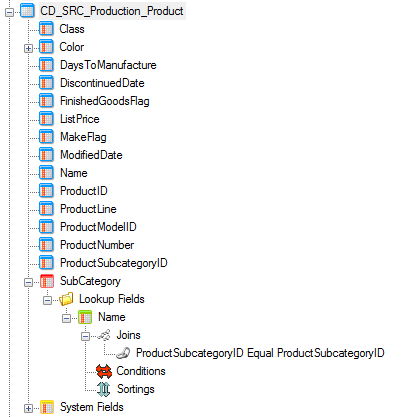
Method 1 is to drag the column down from the lookup table to the main table and set the join by the keys that match between the 2 tables. For example we have ProductSubcategory and Product where ProductSubcategoryID is the key between the lookup table ProductSubcategory and the main table Product.This is considered a Left outer Join which will send rows that don’t match into the Warning table.

lookup

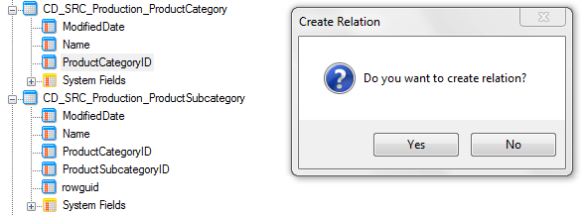
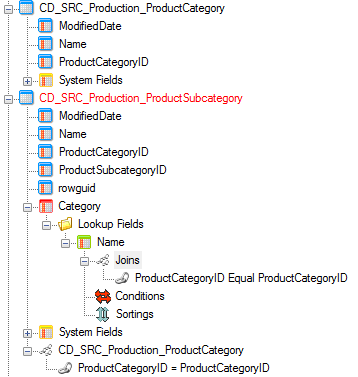
Method 2 is to drag the key from the lookup table to the foreign key of the main table. So for this example we drag the ProductCategoryID from ProductCategory table to the ProductCategoryID in the ProductSubCategory table. This will give an option to create a relation.

relation

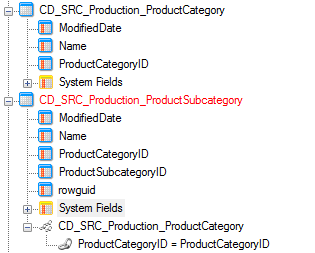
We can see the relationship created for the ProductCategoryID below:

created_relation

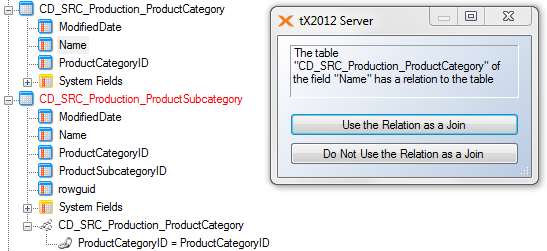
Now we want to drag the Name from ProductCategory to the ProductSubCategory table and it will ask us if we want to use that relation that we just created to join the table for this field.

catnamerelation

So we can see that join uses the same Keys that the relation has and this now gives us some leverage to change how that joins acts.

finalcatnamejoin

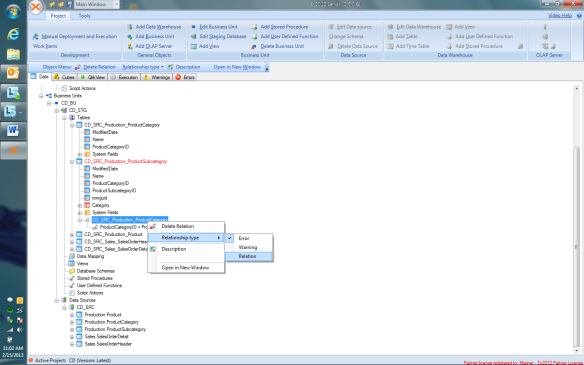
Lastly we can change the way that the join behaves by a right click on the relationship to change the options as follows:
(Click to enlarge image)

RelationView

So we need to define the 3 relationship settings in terms of joins:
1. Error (Inner Join)
2. Warning (Left Outer Join)
3. Relation (Full Outer Join)

Tabular AMO 2012

This is a great article on codeplex about creating a tablular model using AMO 2012. I am in the process of designing methods to extract information from the BISM tabular model using AMO and XML. I just wanted to share this with you as I will begin to analyze this method further. I will be posting some code here and there to show the differences from Multidimensional and tabular AMO.

Link: Tabular AMO 2012